Every year I ask property managers to tell me how big they actually are. Most years, a couple hundred do. This year, 390+ did, and the extra data changed what I thought I knew about what "big" actually looks like in this industry.
I published the full, searchable Top 40 list on the site already, broken out by state for the first time. This post is the deeper look at what the numbers behind that list are actually telling us, section by section. If you already saw the newsletter version, this goes further into each chart than I had room for there.
This year's list is presented by Boom.
The Top 10, and What It Doesn't Show
Here's the top of the list:
| # | Company | Location | Doors |
|---|---|---|---|
| 1 | Darwin Homes | Austin, TX | 24,100 |
| 2 | Evernest | Birmingham, AL | 12,000 |
| 3 | Renosy by Renters Warehouse | Minneapolis, MN | 8,500 |
| 4 | REI Nation | Memphis, TN | 8,113 |
| 5 | On Q Property Management | Gilbert, AZ | 8,109 |
| 6 | JWB | Jacksonville, FL | 7,400 |
| 7 | Kleinman Property Management | Minneapolis, MN | 7,111 |
| 8 | Atlas Real Estate | Denver, CO | 6,100 |
| 9 | Grandmark Property Management | Grand Rapids, MI | 6,023 |
| 10 | 2B Living | San Carlos, CA | 5,700 |
A couple things jump out. Darwin Homes isn't just #1, it's more than double #2: 24,100 doors against Evernest's 12,000. That's a bigger gap than between #2 and #10 combined. And Minneapolis, of all places, has two companies in the top 10 (Renosy by Renters Warehouse and Kleinman). I did not see that coming.
But the list also has to be read next to what's missing from it. Pure HomeRiver was sitting around 40,000 doors as of January (which would've put it at #1 by a wide margin), and Northpoint reported 6,400 last year before losing a large account. Both declined to submit for 2026. That's not a knock on the list; it's just the nature of self-reported data. The published Top 10 is a floor on what "largest" really looks like in this industry, not a ceiling. The biggest, most institutional players are also the ones with the least incentive to hand a competitor their real door count.
See the full Top 40 and all the underlying data →
Where the Doors Actually Are
For the first time this year, we had enough state-level submissions to actually map it:
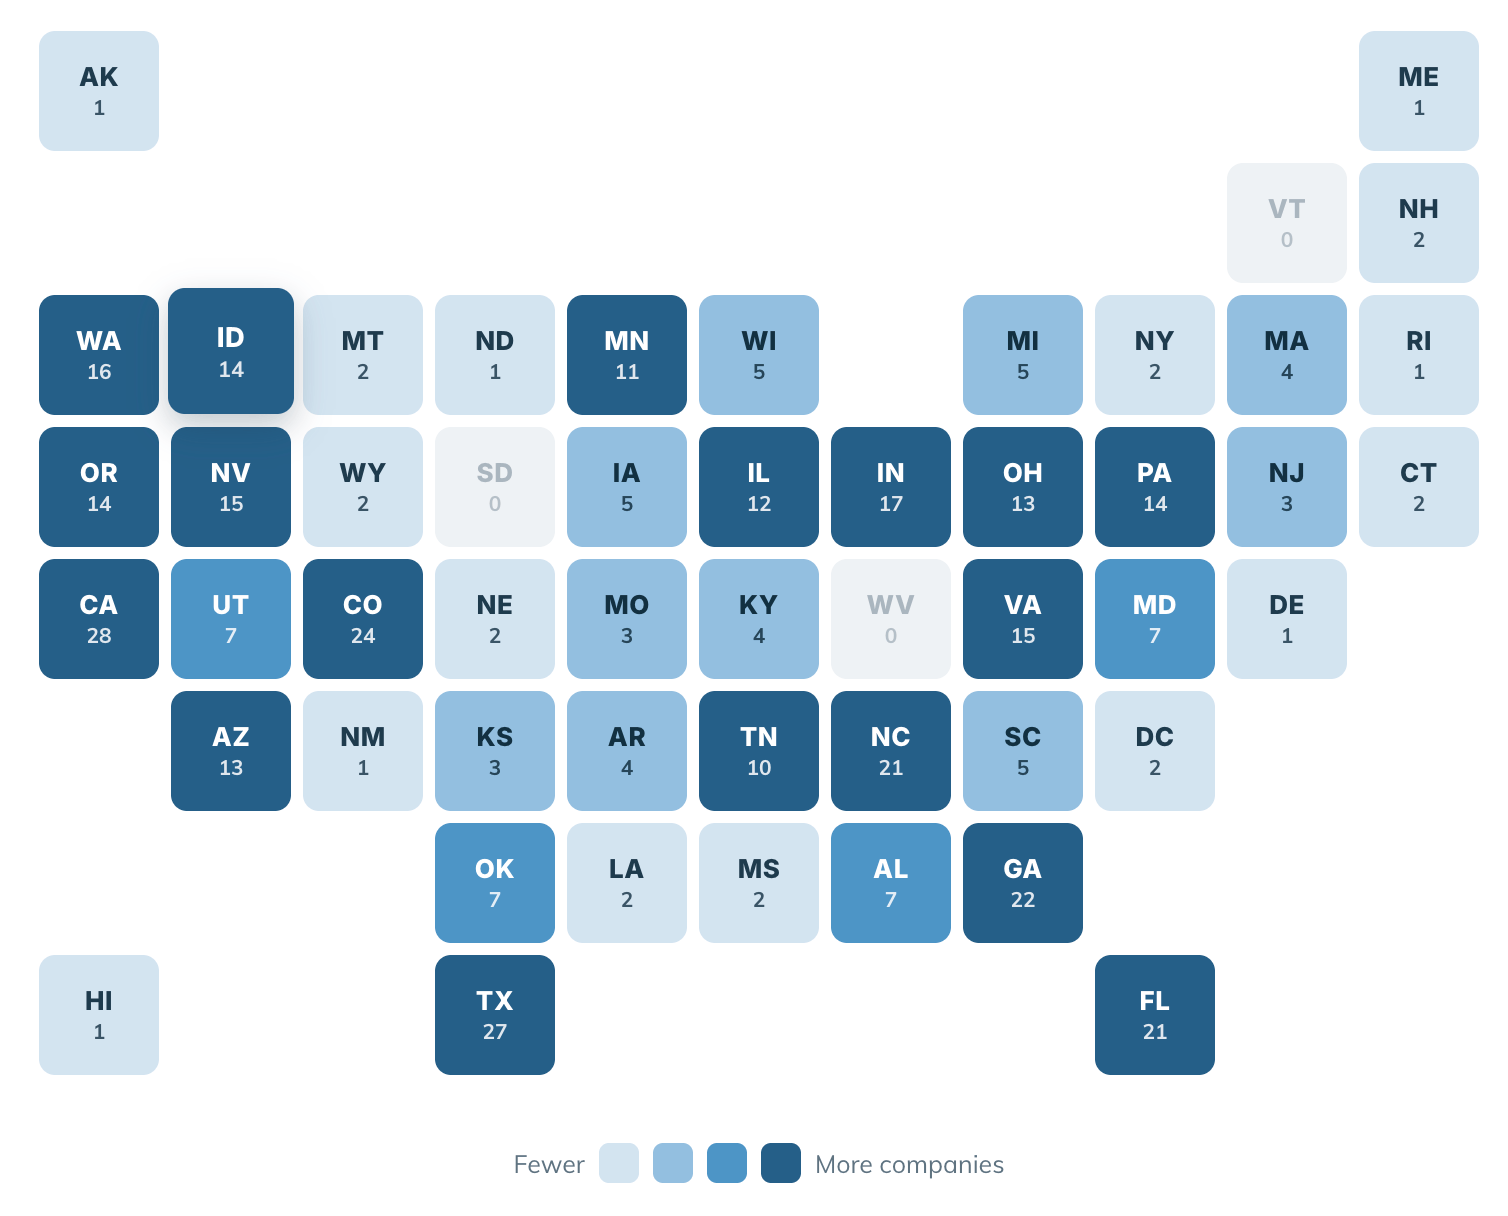
This map is showing submission volume, not total market size, so treat it as a proxy, not a census. But the pattern is still useful. California (28 submissions), Texas (27), Colorado (24), Georgia (22), and North Carolina and Florida (21 each) lead the country. That's mostly the corridor you'd expect if you've been paying attention to where scattered-site SFR portfolios have concentrated over the last decade. What surprised me was the Pacific Northwest cluster: Washington (16), Idaho (14), and Oregon (14) are punching well above what their population would predict.
Click into your state for the full breakdown →
What They Run
This is the one I get asked about constantly, so here's the real breakdown, based on the 392 companies that answered the software question:
Accounting software
What the largest operators run their books on. Based on the 392 companies that reported.
AppFolio: 230 companies, 59%. Rentvine: 76, 19%. Buildium: 39, 10%. Rent Manager: 20, 5%. Propertyware: 13, 3%.
The share numbers only tell half the story, though. When you cut it by median door count per platform, the picture flips a little:
Median size by software
Typical (median) door count among companies on each platform. Count in parentheses.
Rentvine has the second-highest adoption count on the list but the lowest median size, at 350 doors, well behind AppFolio's 670. That tells me Rentvine's growth right now is coming from a broad base of mid-size, fast-growing operators, not from being the default choice of the very largest shops yet. Meanwhile Rent Manager and Propertyware have small adoption counts (20 and 13 companies) but the highest median door counts on the list. Those read like legacy platforms that older, larger, more entrenched portfolios never had a strong reason to migrate off of. AppFolio is the one platform that shows up at both ends (most companies and one of the highest median sizes), which is a different kind of dominance than just having the biggest logo count.
How They're Organized
Org structure, from the 387 companies that answered:
How they're organized
Structure across the 387 companies that reported.
Departmental is still the default: 183 companies, 47%. Pod-departmental hybrid is a clear second at 30% (117 companies). But size tells a different story than popularity does:
Median size by structure
Typical (median) door count by how the company is organized. Count in parentheses.
The hybrid model is both the second-most-common structure on the list and the one with the highest median door count, at 700, ahead of pure departmental (544) and pure portfolio (550). I want to be careful here: this doesn't prove hybrid causes growth. It's just as likely that companies drift toward a hybrid model as they cross a certain size, rather than the hybrid model being what got them there. Probably some of both is true. But at minimum, it means the biggest operators on this list generally aren't running a textbook-pure version of either model by the time they scale.
Who Grew the Fastest
Among companies that submitted in both 2025 and 2026 with a 2025 base of 300+ doors, here's the biggest year-over-year jumps:
| Rank | Company | 2025 | 2026 | Change |
|---|---|---|---|---|
| 1 | Auben Realty | 2,184 | 3,204 | +46.7% (+1,020 doors) |
| 2 | JWB | 5,300 | 7,400 | +39.6% (+2,100 doors) |
| 3 | On Q Property Management | 6,291 | 8,109 | +28.9% (+1,818 doors) |
Worth noting: JWB and On Q aren't just on this growth list, they're also #6 and #5 on the overall Top 10. That runs against the usual assumption that growth rate slows down once a company gets big: both are already managing 7,000+ doors and still posted close to 30-40% growth in a single year. Auben Realty is the outlier in a different way: smaller base, biggest percentage jump, and the only one of the three not currently in the overall Top 10.
See the full fastest-growing Top 10 →
How Reliable Is Self-Reported Data, Really?
Every number on this list came from the operator, not from a public filing or a database I can independently audit. A few ground rules I hold the list to:
- Only third-party-managed doors count. Owned units don't.
- SFR and small multifamily (under 100 units) only, no HOAs, no big multifamily.
- Based on 390+ submissions for 2026.
I'm sure a few of these numbers are rounded generously, and I have no way to verify every submission independently. But this is the tradeoff with any self-reported industry list: nobody else is tracking scattered-site SFR portfolios closely enough to rank them, and the alternative to asking operators directly isn't a more accurate list, it's no list at all.
Check the Full List
Everything above is a summary of what's in the full Top 40 list: the complete rankings, every state breakdown, and the full fastest-growing Top 10. If you run a PM company, it's worth a few minutes just to see where you'd land.
Explore the full 2026 Top 40 list →
Submissions for 2026 are closed, but I'll keep the list updated as corrections come in, and I'll put out the call for 2027 data in the newsletter when it's time. Subscribe here if you want the heads-up.
Thanks again to Boom for sponsoring this year's list.
- Peter